
Beginner
Data Analysis
Collecting, cleaning, interrogating and presenting data using Excel, SQL, Python, Power BI and Tableau. Follows the full analysis workflow rather than a tool list, starting at a messy real dataset and finishing with a dashboard and a recommendation a manager can act on.
- 58 lessons
- Beginner
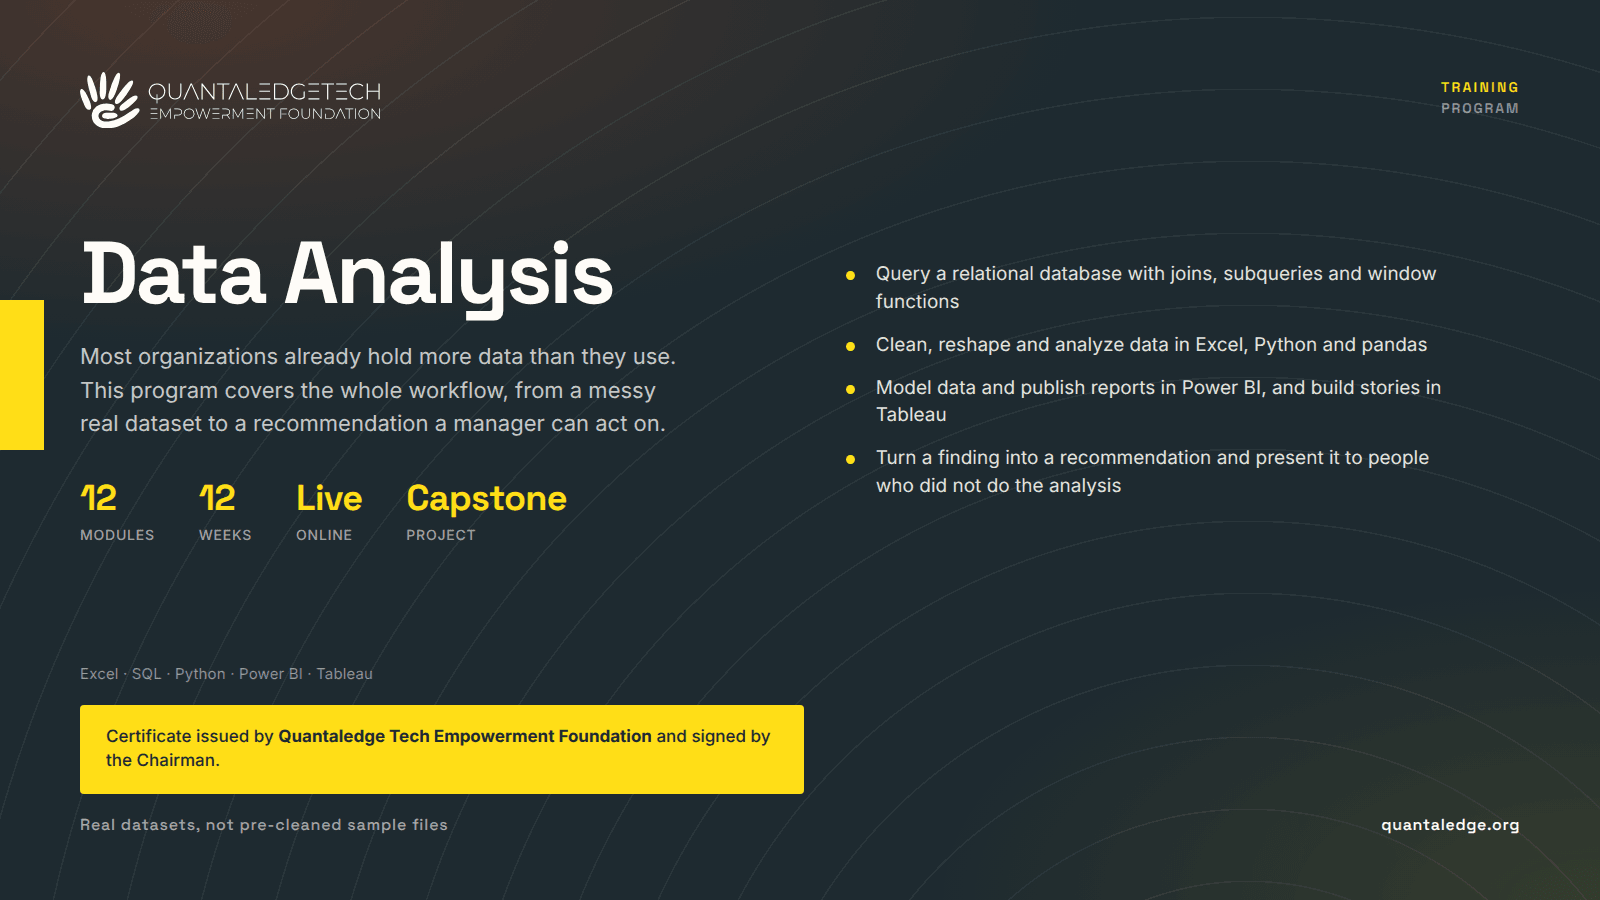
Most organizations already hold more data than they use. This course turns a learner into someone who can collect it, clean it, interrogate it and say what it means, using the tools the job actually asks for.
It follows the full analysis workflow rather than a tool list. A learner starts with a messy real dataset and finishes with a dashboard and a recommendation a manager can act on, which is the part most training leaves out.
What a graduate can do
- Describe the data analysis workflow and tell structured, semi-structured and unstructured data apart.
- Clean, reshape and summarize data in Excel using advanced formulas, PivotTables and Power Query, and build an interactive dashboard in it.
- Query a relational database in SQL, including joins, grouping, aggregation, subqueries and window functions.
- Apply descriptive statistics, sampling, hypothesis testing, confidence intervals, correlation and regression, and read the result of an A/B test correctly.
- Manipulate and analyze data in Python with NumPy and pandas, and handle CSV, JSON and Excel sources.
- Choose the right chart for the question and build it in Matplotlib, Seaborn or Plotly.
- Model data and build published reports in Power BI, writing DAX where the measure calls for it.
- Build worksheets, calculated fields, dashboards and stories in Tableau and share them.
- Collect data from APIs and by web scraping, then assess and validate its quality.
- Run exploratory analysis, cohort analysis, customer segmentation, time series analysis and basic forecasting against business KPIs.
- Turn a finding into a written recommendation and present it to people who did not do the analysis.
How it is taught
Twelve weeks, two sessions a week of two to three hours, online and instructor-led, with a self-paced track alongside it. Learners work in Excel, a live SQL database, Python in Jupyter notebooks, Power BI Desktop and Tableau Desktop, against real datasets drawn from several industries rather than sample files that have already been cleaned.
Assessment and certification
Weekly assignments and practical exercises, then a capstone analysis presented at the end. The capstone doubles as the first item in a learner's portfolio.
Finishing the course does not produce a certificate on its own. The certificate is issued by Quantaledge Tech Empowerment Foundation and carries the signature of the Chairman.
Before you start
None. No prior programming experience is assumed.
What the course covers
12 modules · 58 lessons
1. Introduction to data analysis
What data analysis is and why it matters, structured against unstructured and semi-structured data, the analysis process and workflow, and the career opportunities in the field.
- What data analysis is and why it mattersEnroll to open
Reading · optional
- Types of data: structured, unstructured and semi-structuredEnroll to open
Reading · optional
- The data analysis process and workflowEnroll to open
Reading · optional
- Career opportunities in data analysisEnroll to open
Reading · optional
2. Excel for data analysis
Advanced functions including VLOOKUP and INDEX-MATCH, PivotTables and PivotCharts, cleaning and transformation, Power Query, and interactive dashboards.
- Advanced functions and formulas, including VLOOKUP, INDEX-MATCH and IF statementsEnroll to open
Reading · optional
- PivotTables and PivotCharts for summarizationEnroll to open
Reading · optional
- Data cleaning and transformation techniquesEnroll to open
Reading · optional
- Power Query for data import and transformationEnroll to open
Reading · optional
- Building interactive dashboards in ExcelEnroll to open
Reading · optional
3. SQL for data analysis
Relational database management systems, SELECT, WHERE, JOIN, GROUP BY and HAVING, aggregation and subqueries, INSERT, UPDATE and DELETE, and window functions.
- Databases and relational database management systemsEnroll to open
Reading · optional
- Writing queries: SELECT, WHERE, JOIN, GROUP BY, HAVINGEnroll to open
Reading · optional
- Aggregation functions and subqueriesEnroll to open
Reading · optional
- Data manipulation: INSERT, UPDATE, DELETEEnroll to open
Reading · optional
- Window functions and advanced techniquesEnroll to open
Reading · optional
4. Statistics for data analysis
Descriptive statistics, probability distributions and sampling, hypothesis testing and confidence intervals, correlation and regression, and statistical significance and A/B testing.
- Descriptive statistics: mean, median, mode, standard deviationEnroll to open
Reading · optional
- Probability distributions and samplingEnroll to open
Reading · optional
- Hypothesis testing and confidence intervalsEnroll to open
Reading · optional
- Correlation and regression analysisEnroll to open
Reading · optional
- Statistical significance and A/B testingEnroll to open
Reading · optional
5. Python for data analysis
Python fundamentals, NumPy for numerical computing, pandas for manipulation and analysis, cleaning and preprocessing, and working with CSV, JSON and Excel.
- Python fundamentals: variables, data types and control structuresEnroll to open
Reading · optional
- NumPy for numerical computingEnroll to open
Reading · optional
- pandas for data manipulation and analysisEnroll to open
Reading · optional
- Cleaning and preprocessing in PythonEnroll to open
Reading · optional
- Working with CSV, JSON and Excel formatsEnroll to open
Reading · optional
6. Data visualization
Principles of effective visualization, choosing the right chart type, Matplotlib and Seaborn, interactive charts with Plotly, and dashboard design.
- Principles of effective visualizationEnroll to open
Reading · optional
- Choosing the right chart typeEnroll to open
Reading · optional
- Matplotlib and SeabornEnroll to open
Reading · optional
- Interactive visualization with PlotlyEnroll to open
Reading · optional
- Dashboard designEnroll to open
Reading · optional
7. Power BI
Power BI Desktop, data import and the Power Query Editor, data modeling and relationships, DAX fundamentals, interactive reports, and publishing through the Power BI Service.
- Power BI DesktopEnroll to open
Reading · optional
- Data import and the Power Query EditorEnroll to open
Reading · optional
- Data modeling and relationshipsEnroll to open
Reading · optional
- DAX fundamentalsEnroll to open
Reading · optional
- Interactive reports and dashboardsEnroll to open
Reading · optional
- Publishing and sharing through the Power BI ServiceEnroll to open
Reading · optional
8. Tableau
Tableau Desktop, connecting to and preparing data sources, worksheets and visualizations, calculated fields and table calculations, dashboards and stories, and sharing through Tableau Server.
- Tableau DesktopEnroll to open
Reading · optional
- Connecting to data sources and preparing dataEnroll to open
Reading · optional
- Building worksheets and visualizationsEnroll to open
Reading · optional
- Calculated fields and table calculationsEnroll to open
Reading · optional
- Interactive dashboards and storiesEnroll to open
Reading · optional
- Tableau Server and sharingEnroll to open
Reading · optional
9. Data collection and web scraping
Collection methodologies, APIs and data extraction, scraping in Python with BeautifulSoup and Scrapy, and data quality assessment and validation.
- Data collection methodologiesEnroll to open
Reading · optional
- APIs and data extractionEnroll to open
Reading · optional
- Web scraping in Python with BeautifulSoup and ScrapyEnroll to open
Reading · optional
- Data quality assessment and validationEnroll to open
Reading · optional
10. Business intelligence and analytics
Business metrics and KPIs, exploratory data analysis, cohort analysis and customer segmentation, time series analysis and forecasting, and predictive analytics fundamentals.
- Business metrics and KPIsEnroll to open
Reading · optional
- Exploratory data analysisEnroll to open
Reading · optional
- Cohort analysis and customer segmentationEnroll to open
Reading · optional
- Time series analysis and forecastingEnroll to open
Reading · optional
- Predictive analytics fundamentalsEnroll to open
Reading · optional
11. Data storytelling and communication
Translating insight into a business recommendation, building a data narrative, presenting to stakeholders and executives, and report writing.
- Translating insight into a business recommendationEnroll to open
Reading · optional
- Building a data narrativeEnroll to open
Reading · optional
- Presenting to stakeholders and executivesEnroll to open
Reading · optional
- Report writing and documentationEnroll to open
Reading · optional
12. Capstone project
An end-to-end analysis on a real-world dataset, from cleaning and exploration through to interactive dashboards, a presentation, and a portfolio piece to keep.
- An end-to-end analysis on a real-world datasetEnroll to open
Reading · optional
- Cleaning, exploration and analysisEnroll to open
Reading · optional
- Interactive dashboards and visualizationsEnroll to open
Reading · optional
- Presentation, and a portfolio piece to keepEnroll to open
Reading · optional
Past cohorts
Runs of this course that have already been taught, with a facilitator and a group working through it together.